Setting up Coverage Data#
Steps 1–6 walk through setting workspace filters, choosing a file, scattering breakpoints across it, generating traffic, and validating the snapshot data before building the dashboard.
Step 1: Set Workspace Filters#
dtctl resolves the Live Debugger workspace from the current working directory.
Before creating breakpoints, tell it which workload to target:
dtctl update breakpoint --filters k8s.namespace.name:easytrade
Replace easytrade with your actual namespace if different.
You can also filter by a specific process group instance:
dtctl update breakpoint --filters k8s.namespace.name:easytrade,dt.entity.process_group_instance:PROCESS_GROUP_INSTANCE-1234567890ABCDEF
Step 2: Pick a File and Identify Candidate Lines#
For this example, use OrderController.java from the EasyTrade creditcardorderservice.
The same pattern works for any file type that Live Debugger can instrument.
SRC=easytrade/src/credit-card-order-service/src/main/java/com/dynatrace/easytrade/creditcardorderservice/OrderController.java
FILE=$(basename "$SRC")
Start by listing the file with line numbers to get a feel for its structure:
nl -ba "$SRC" | sed -n '100,340p'
At this point you have two choices:
- Manual placement — choose exact lines that matter
- Scatter placement — generate a broader set of candidate lines and instrument them in bulk
For coverage-style analysis, scatter placement is the better fit.
Step 3: Scatter Breakpoints Across Executable-Looking Lines#
A simple way to generate candidate lines is to skip blank lines and obvious comment-only lines, then sample the rest.
SRC=easytrade/src/credit-card-order-service/src/main/java/com/dynatrace/easytrade/creditcardorderservice/OrderController.java
FILE=$(basename "$SRC")

awk '
  {
    line = $0
    sub(/^[[:space:]]+/, "", line)
    sub(/[[:space:]]+$/, "", line)
  }
  line == "" { next }
  line ~ /^\/\// { next }
  line ~ /^\/\*/ { next }
  line ~ /^\*/ { next }
  line ~ /^@/ { next }
  line ~ /^(package|import)[[:space:]]/ { next }
  line ~ /^[{}]+$/ { next }
  line ~ /^(public|protected|private|abstract|final|sealed|non-sealed)?[[:space:]]*(class|interface|enum|record)[[:space:]]/ { next }
  line ~ /^(public|protected|private|static|final|abstract|synchronized|native|default|strictfp)[[:space:]]/ && line ~ /\)[[:space:]]*(throws[[:space:]].*)?\{?$/ { next }
  { print NR }
' "$SRC" \
  | shuf \
  | head -n 20 \
  | sort -n \
  > breakpoint-lines.txt

cat breakpoint-lines.txt
That gives you a reproducible list of candidate line numbers while skipping obvious non-executable lines such as comments, annotations, imports, braces, class declarations, and likely method signatures.
Create one Live Debugger breakpoint per line:
while read -r line; do
  echo "Creating breakpoint at ${FILE}:${line}"
  dtctl create breakpoint "${FILE}:${line}"
done < breakpoint-lines.txt
If you want to start with a smaller hand-picked set before scattering wider, use a file like this instead:
cat > breakpoint-lines.txt <<'EOF'
113
115
121
132
157
188
214
241
267
300
306
EOF
Then run the same loop.
Step 4: Verify the Breakpoint Set#
List the breakpoints in the current workspace:
dtctl get breakpoints
Inspect a specific location:
dtctl describe breakpoint "OrderController.java:306"
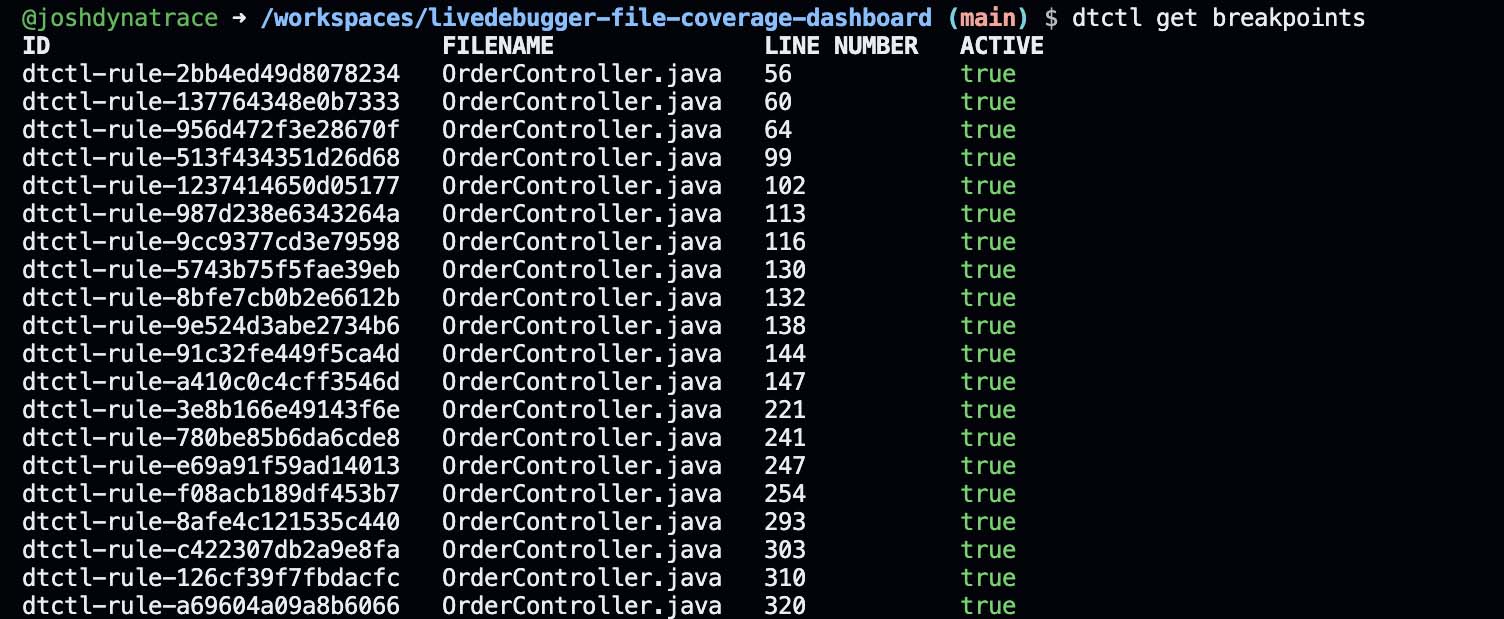
If you want a structured inventory of the scatter set:
dtctl get breakpoints -o json
Store the total number of instrumented lines as your denominator for the dashboard:
TARGET_LINES=$(wc -l < breakpoint-lines.txt | tr -d ' ')
echo "$TARGET_LINES"
If TARGET_LINES=11, your dashboard can compute a percentage from snapshot activity alone.
Step 5: Generate Traffic Through the File#
Now hit the application path that exercises the file. In this case, the EasyTrade application has a load generator running which sends traffic through our file of interest, the OrderController.java.
But this can also be:
- A curl loop against the service endpoint
- An integration test suite
- A replay workload
- A synthetic monitor
- A workflow that calls the service
For example:
for _ in $(seq 1 50); do
  curl -sS "https://your-service.example/api/orders/latest-status" > /dev/null
done
Each time one of your scattered breakpoints is hit, Live Debugger emits a snapshot record into application.snapshots.
Step 6: Inspect Raw Coverage Data from application.snapshots#
Before building the dashboard, validate the data path directly with dtctl query.
Most recent snapshots for the file#
dtctl query '
fetch application.snapshots
| filter code.filepath == "OrderController.java"
| sort timestamp desc
| fields timestamp, code.filepath, code.function, code.line.number, snapshot.id, trace.id
| limit 20
'
Distinct hit lines in the file#
dtctl query '
fetch application.snapshots
| filter code.filepath == "OrderController.java"
| summarize covered_lines = countDistinct(code.line.number)
'
Hits by function and line#
dtctl query '
fetch application.snapshots
| filter code.filepath == "OrderController.java"
| fieldsAdd line = toLong(code.line.number)
| summarize hits = count(), by: { code.function, line }
| sort code.function asc, line asc
'
Coverage summary for the scattered set#
Replace 11 with the number of breakpoints you actually created.
dtctl query '
fetch application.snapshots
| filter code.filepath == "OrderController.java"
| summarize total_hits = count(), covered_lines = countDistinct(code.line.number), functions_hit = countDistinct(code.function)
| fieldsAdd target_lines = 11
| fieldsAdd coverage_pct = round(100.0 * covered_lines / target_lines, decimals: 2)
'
This is the core trick: the numerator comes from distinct line numbers in application.snapshots, and the denominator comes from the set of lines you intentionally instrumented.